Time for a chat about humidity and the internal environment.
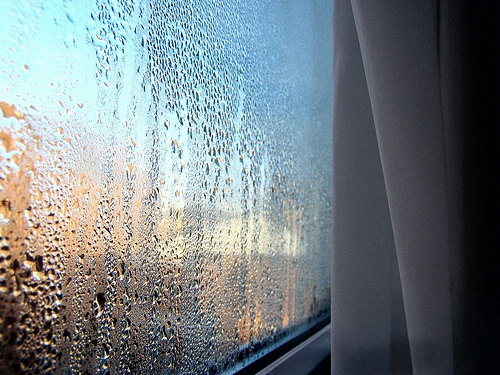
Water running down the double glazing?
A student asked me the other day “Why would I need to find out the vapour pressure in a house, when I already have the Relative Humidity”?
A great question and one which others have asked, so I thought I’d explain the practical benefit of using vapour pressure and relative humidity – both are useful.
First, a quick recap on the difference between relative humidity (RH), and Vapour pressure (Vp).
Relative Humidity.
We hear this spoken and written about a lot in building survey and damp survey reports. It is always expressed as a per cent (%). Easy to understand that 90% is higher than 75% and 65% is lower than 85%. Simple? Well, not quite.
Here’s a common definition of RH – “The amount of water vapour present in air expressed as a percentage of the amount needed for saturation at the same temperature”. So 75%rh means that at the temperature when measured, the air was three quarters saturated. 100% being saturated and known as the dew point. We can nudge the RH up to dew point by either cooling the air, which will mean that the RH rises as a proportion or, we can add more water vapour. The fact is that as RH rises or falls, we have no way of knowing what is happening… is it the temperature falling, or the amount of water vapour reducing – or a bit of both?
Vapour pressure
In meteorological terms – partial vapour pressure, which is a direct measure of the amount of water vapour in the air. Of course as more water molecules evaporate and enter the air as a gas, they do exert pressure. A tiny part of atmospheric pressure, but nevertheless it is there and can be calculated using a hygrometer and thermometer. Remember that the environment isn’t a ‘closed system’ like say, the gas over a liquid inside a cylinder, so when Vapour pressure is stated it is not by measurement, but by calculation. However, it helps to think of it as ‘pressure’ because it is energy, which causes water molecules to escape their liquid state and enter the air as a gas. They add energy to the air mass and in fact the addition of water vapour to air reduces it’s mass – warm moist air rises, so convection currents are encouraged by evaporation (we could explore all these effects for hours but let’s stick to the point).
These water molecules will travel freely in the air for as long as energy levels allow, before eventually being re-absorbed into a liquid state. As Vp rises in the kitchen, it spreads out and Vp rises in other rooms too and so on. Unlike RH, vapour pressure it is an ‘amount’ so for example 1kPa (kilopascal) is more than 0.5kPa because the former sample had more water vapour in it – regardless of the temperature of the air.
Confusion reigns in respect of RH and I’ve seen quite a few survey reports where the RH has been used in a misleading way, usually in ignorance rather than by design.
Damp in the cellar of Annie’s House
Consider this scenario, lifted straight from a presentation I attended, where the speaker (a surveyor), demonstrated a poor understanding of the terms…
This is what he stated….. “I measured the RH in the lounge of the house and found it to be 65%, however, the RH in the cellar was over 85%, demonstrating that the cellar was damp”. The surveyor then set about finding a cause for that and settled on a leaking window frame.
It is correct that 85% is a higher RH than 65%, but it is totally wrong to affirm that this shows the cellar was damp, in comparison to the lounge. This is because of the ‘Relative’ in relative humidity. It is relative to temperature. This is crucial because the ability of air to retain water vapour is dependent on the temperature of the air. Thus warm air can retain more water vapour than cold air and cold air less so. So in the case the surveyor quoted above, it could easily be the case that the cellar was a little cooler than the lounge, but it may have had the same amount of water vapour in it. In this case the higher RH would merely demonstrate that the cellar was colder, or the lounge was warmer if you like. So with the same amount of water vapour present in both spaces – the RH could vary.
What if the cellar was actually ‘wetter’ though? How would we know? This is where specific measurement of the amount of water vapour in the air is useful. For this, we need to know the air temperature. In simple terms, if the air temperature is lower then the RH will rise, if higher it will fall (all other things being equal). On site, things are not always that simple, because there could well be a source of water vapour. At this stage, with only the RH to go by we do not know.
The surveyor I mentioned earlier could well be right (by luck), and there may be more water vapour in the air in the cellar. It’s a guess though, because RH has been quoted in isolation. Air temperatures will of course tell the surveyor something. If it is lower in the cellar, that may confirm that all or some of the increase in RH is due to that temperature drop. This cannot be certain; is there another source of water vapour too? How can the surveyor get the truth?
This is where a psychrometric chart comes in. Using the chart allows easy and fast use of the RH and air temperature measurements to identify the Vapour pressure (or g/kg, millibars, g/m2 or other ways to quantify the same thing). This is a specific measure of the amount of water vapour in the air. It is not influenced by air temperature so we can compare the Vp in the lounge and the cellar to really see – ‘which is wetter’?
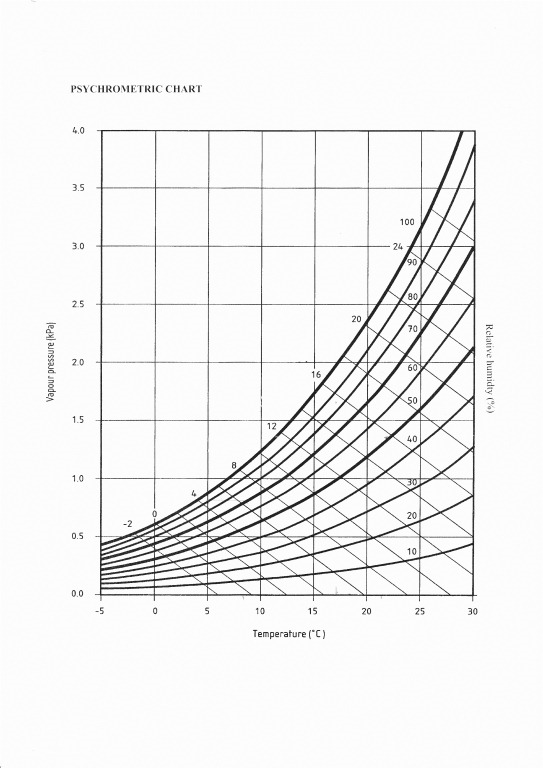
This chart is an invaluable aid for use on site – it comes from BS5250 – buy the standard and copy and laminate the chart for your briefcase.
With my surveyor’s hat on, I like to be practical in these matters so the scenario I’ve painted below is one where the house is occupied and centrally heated. The cellar is not really used much but the fuel store in there has a tumble drier in it. It’s a condenser dryer but not a very efficient one.
Our lounge is a balmy 180C with a RH of 65%. Using our chart we can see that the Vp is 1.34kPa (kilopascals). Means little to me on its own, but let’s see what the cellar is like…
At 120C and 85%rh we have a vapour pressure of 1.19kPa in the cellar. To put that in another way let’s look at the mixing ratio of the air in both rooms. This is just a conversion, which can be done with a chart or with Vaisala’s handy humidity calculator. It equates to 8.37g/kg (grams of water per kilo of dry air), in the lounge and 7.43g/kg in the cellar.
So the cellar is not wetter it is dryer than the lounge. As it happens that 0.94g/kg difference in mixing ratio equates to a differential Vp of 0.15kPa. Why have we got such a difference in the amount of water vapour in the lounge, as opposed to the cellar? The difference isn’t that high, though it is dryer, not wetter, as the surveyor stated.
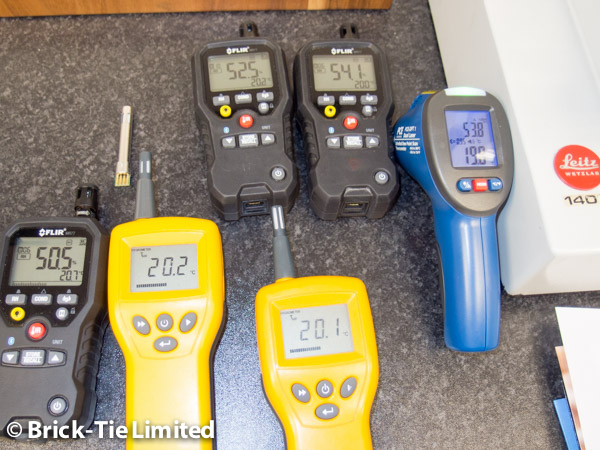
So many hygrometers to choose from – use them well.
We can expect the Vp to vary. This goes for air temperature and RH too. This is a dynamic situation. However, some rules apply and it’s worth noting these.
In an empty, unoccupied house (which has not been recently flooded), we can expect the Vp to be dominated by external conditions…
This is because the house is a tiny speck on the face of the planet and the external atmosphere is infinitely larger (well not infinity but almost). Thus when vapour pressure is high outside , the vp indoors will rise and when it is dryer outside the Vp inside the house will fall towards it. This is a balance brought about by the complex relationships between gasses. Pressure will run down its pressure gradient and water vapour will leak out from the house when it is dry outside and leak in when conditions are positive. There will be a lag of course, depending on how airtight the house is. A modern sealed up house complying with all of the building regulations will maintain a more stable environment, but not for long. Old houses with open hearths and such will balance more quickly.
In an occupied house, the people in the house are the next largest influences on the internal environment. Some would say they are the primary one. However anyone who has studied external and internal differential vapour pressures over time, will see that whilst the occupants add lots of vapour – it is in addition to that which is there (or not there), as a result of external forces.
How can we quantify water vapour contributions from evaporation?
Putting this into some sort of context, lets look at the amount of water vapour given off by say, a washing machine used for a couple of hours every other day. More specifically let’s imagine that in the house we chose to look at, the tumble dryer in the cellar has been running for two hours just before the surveyor called. What has that done to the internal environment of the cellar?
We need two more measurements to get the contribution of the dryer to the 85%rh the surveyor wrote down. How much water vapour was produced? Let’s say that the machine emitted 50g/h of water. So we have to assume that about 100g of water in the cellar air was already there as a result of the tumble dryer. How do we deduct that from the Vp in the cellar? And what would the RH have been if that machine had not been used? No doubt it would be even lower – so the difference in the amount of water vapour in the lounge and cellar is much higher than we imagined.
For the purposes of example we are going to assume (for now), that the cellar is not well ventilated and is not half full of hygroscopic materials (like wood or salt). This effects water vapour retention and release and is called hygroscopic buffering, however for this post we can put that on one side.
We need to know the size of the cellar, because we are going to work in g/kg and then convert that to Vp. So first, how big is the cellar? I have this at 8x5x1.9M so that’s 76m3. How many kilograms of air are in a room that size? Let’s use 1kg of dry air occupies 0.833m3 of space (roughly, let’s not get into tiny fractions and remember that air pressure and such vary so this is a close approximation). There are 91.23kg of dry air in the cellar. I know that the machine added 100g of water (so in effect the wet clothes weighed 10kg and now they weigh 9.9kg. 100 shared out 91.23 times is 1.09, so we can see that of the 7.43g/kg water vapour in the air of the cellar at the time the surveyor measured it, 1.09g/kg was from the dryer. So, without the addition of the water from the dryer the mixing ratio in the cellar would have been 6.34g/kg. This equates to a Vp of only 1.02kPa. That’s a full 0.32kPa lower than the lounge. We can use our chart and see that had the dryer not been on before our surveyor arrived, the RH would have been only 72%rh. That’s ‘miles’ dryer than the lounge, but the surveyor would still have stated it was wetter if he/she relied on RH in isolation.
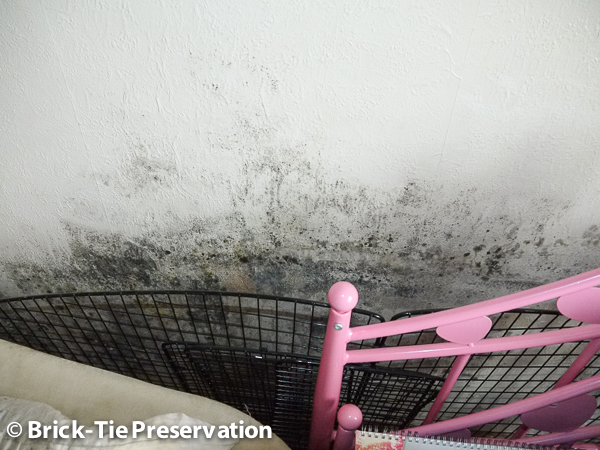
In a humid house the final result may be condensate and mould in areas where the walls are insulated from the warming effects of the heating system.
Conclusion.
In this hypothetical scenario the higher rh in the cellar was due to a combination of the colder air temperature AND the contribution of the tumble dryer. However, even with the contribution of the dryer, the cellar was dryer than the lounge. In an occupied house this would be expected. Now then, what would have made the work more relevant to the real world?
External differential vapour pressures.
As mentioned earlier external vapour pressure fluctuates and tends to drag the internal Vp with it. This is why taking a corresponding external measurement is crucial whenever a surveyor refers to the internal conditions. The extent of the differential between the internal and external measurements is an essential component of our detective work. It will give guidance on the balance between moisture production in a building and the ventilation regime.
So Relative humidity; any use?
If the above looks like I decry the use of rh I apologise – I do not. RH is a great way of seeing if conditions in a building are ‘wrong’. By that I mean that if RH’s are excessive then mould growth is to be expected and so are problems such as dust mite infestation and associated biological growths. It’s just that, on it’s own a high RH just rings alarm bells, It is then up to the surveyor, using eyes, experience and maybe a hygrometer, psychrometric chart or humidity calculator, to get down into the data and reach a conclusion.
Another short example can use the lounge. We noted that the RH was a little high. However, the Vp, though higher than the cellar, tells us little. What if there was some mould staining in the corners and the window reveals of the lounge, at the time of the survey? The house was warm enough when we visited it at 180C. How can there be mould growth? If we’d calculated the external Vp we’d have some idea of what was really going on.
Chatting with the owner/tenant (always worthwhile), I find that she is in fuel poverty and only uses her heating for short periods. It’s expensive to run and as she says, the house goes cold quick but heats up quick too. At bedtime, when she is tucked up, the heating is off and the lounge air temp falls, along with the surface temperatures in the corners and poorly insulated window reveals. What happens to the rh then? The Vp is unchanged. Our psychrometric chart tells us that if we simply cooled the air in the room to 120C, we’d reach 94%rh. So it turns out that actually the conditions in the lounge are very poor for our tenant/owner. We need to look at the heating regime and the water vapour production and the insulation… we now have the tools to get to the bottom of our client’s problems and solve them.
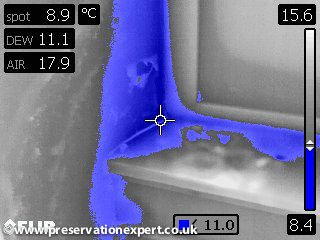
With air temperature falling RH rises and here, the cold uninsulated window reveal is cooling the air to below dew point. This is a conveyor belt of condensate and is running along the window sill.
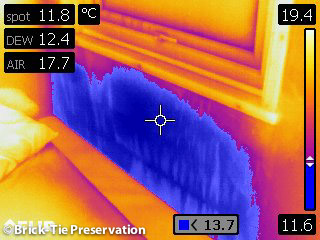
I pulled the bed away from the wall and here the air in the boundary layer is well below dew point – the wall is wet through and there is mould growing by the child’s pillow.
Snap-shot measurements of humidity may be misleading!
Finally we need to consider one more important point. Snap shots of the humidity conditions during a survey may be misleading. The internal environment is a constantly changing phenomenon, with the air temperature and humidity in flux for much of the time. This means that one-off readings can be used only as a guide, with all of the other visible and relevant evidence included in your diagnosis. Longer term monitoring can help, using data loggers. Logging the RH and temperatures, internally and in the external environment, using small inexpensive loggers is revolutionising our understanding of the internal built environment. I’ve posted on this work before. I recommend that any contractors, surveyors or surveying students try to obtain a few of these and have a go at assessing changes, using the data collected on live sites, and even in your own homes. It is a great way of seeing psychrometrics in action, helping understanding and it provokes critical thinking.
I hope the above is helpful and gives food for thought, for students of the internal environment or surveyors wishing to delve a little deeper into damp diagnosis.
Dry Rot.
fantastic read Bryan, loved it..
Spot on Bryan! Great article.
Very kind regards
Steve
Thank you Steve,
I hope it’s helpful to PCA members.
Hi Bryan,
Nicely put in my opinion.
Lee
Thank you Lee,
Only a real damp nerd would bother reading through it – well done 😉
Bryan
Excellent Article!
Thank you very much indeed!
Great work Bryan this is a topic that all surveyors are probably lacking in knowledge and experience. If university courses taught the subject with similar clarity we’d all be a lot wiser.
A well written article, you’re a credit to the industry.
Thanks Dave,
praise indeed…. I wouldn’t go that far but I am very glad that my stuff does the job of educating others. Sharing our experiences improves knowledege and in the end helps our clients and consumers generally.
Have a nice day.
Thank you Dry Rot,
A really helpful, interesting and well-written article.
Kind regards,
Damp Nerd 🙂
Thank you Bill,
I’m glad you enjoyed it. If it helped then that is perfect….
best wishes
Bryan (dry rot)