As I was saying in my last article on this subject, anecdotal evidence for the benefits of PIV’s is good. When I returned to the bungalow in York, last Monday morning it was business as usual; “This is a different house” exclaimed my client “The stuffy feel has gone and you can just tell it’s working” he beamed. This is the tenant who has complained of long lasting ‘damp’, ‘mould’ and a stuffy and dank house.
So, let’s see if this Positive Input Ventilation ‘cure’ for condensation, is any more than a ‘placebo’ effect.
I recovered the loggers and transferred the data onto my laptop there and then. A total of four hundred and thirty two sets of readings were taken, including air temperature & relative humidity. The data loggers automatically display the calculated dew point too. So we have three plots:
- Blue = RH%
- Red = Air temperature
- Green = Dew Point.
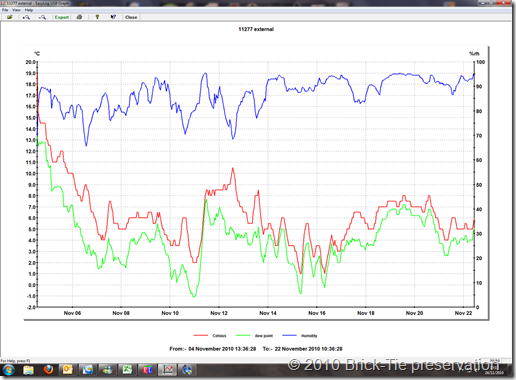
This is a screen shot of the data from the external logger seen under the plant pot in Part 1.
Yes – it is outside the house, we need to know what the difference is, between the inside environment and that prevailing outside.
As you can see the humidity is very high throughout the period 4th November to the 22nd. The average RH% being around the 90% mark for much of the time (blue plot, reading the right hand Y axis). Remember; this may sound a high RH%, but look at the air temp’. It’s very cold, so the air’s capacity to hold water is low – the RH% is merely a reflection of the air’s ability to hold water at that temperature. If you need revision on RH% see this POST
Look at the red and green plots. See how close together they are? (red = temp – green = Dew point – read on left Y axis). For a period during the morning of the 11th November, there was only 0.80C between them – no wonder it was foggy outside! This is typical cold winter weather – very cold and as a result, almost saturated air.
No doubt you’d rather be indoors?
Let’s look at the indoor plot.
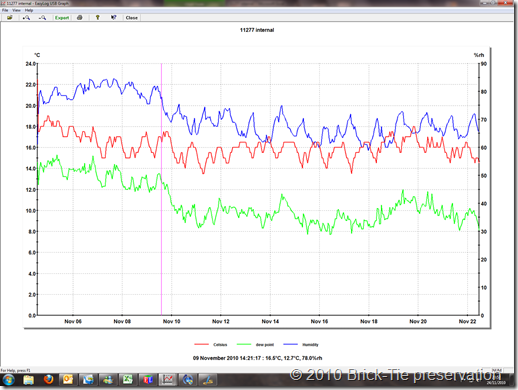
This is the data plot from the logger placed in bedroom 1 – and seen in Part 1
The logging period is the same, but on this graph I have placed the cursor over 9th November at 14:21:17 which is the moment the PIV we installed was turned on. The pink vertical line marks this point.
Whilst the humidity internally is not as high as the external plot, it is falling over the period, whereas the blue plot on the external graph is actually rising. Don’t get excited – going back to my Part 1 article you’ll find that in fact, this is irrelevant. The differences in the outside and inside temperatures make comparisons of the RH% confusing at best and misleading in practice. Going by the plots, it is wetter outside the house. “Of course it is – it’s foggy”. well, let’s look at this and see….
It’s true, the RH% outside is higher, but then again the air temperature inside the house is far higher than it is outside; in freezing Yorkshire. As a result, the warm internal air has a much greater capacity to absorb water vapour, with room to spare. Even when carrying over 50% more water than the outside air it is still reading a lower RH%!
I know this because I have used a Psychrometric chart (from BS5250), to calculate the Vapour Pressure of the air, using the RH% and the air temperature.
Over the period the Vapour Pressure in this part of suburban York was between 0.9 & 0.8 kPc. The internal VP was between 1.6 & 1.2 kPc.
The outside VP was fairly steady on average, though this hides some quite big and fast fluctuations – the inside exhibited quite a fluctuation too, though the peaks and troughs are lower and it was always higher than that outside the house. The dryer internal environment is an illusion, brought about by warmer temperatures.
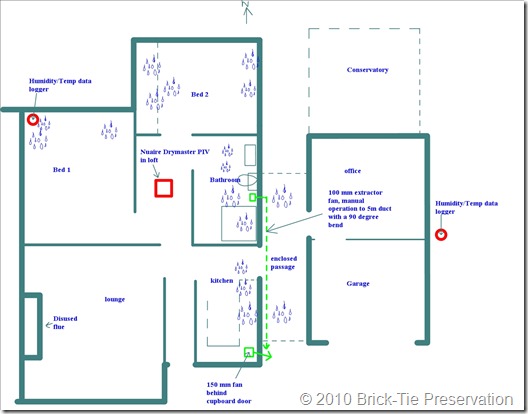
This house has all the symptoms of a damp and unhealthy living space. It is a two bedroom, post war bungalow. It has a fire place – bricked-up. It has double glazing and the detached garage on the drive has been joined to the house by a covered passage – in effect the side wall of the house is now an internal wall. This has resulted in poor ventilation; the bathroom on the side wall is adjacent to the covered passage so the window opens to the indoor environment. There is a fan, but this is the typical 100mm sort, it needs manual operation and the puny motor has to force air through over 5M of ducting to escape to the open. The kitchen has a 150mm extractor fan,but this is behind a cupboard door and is out of sight; “out of mind”. The young couple have started a family and have a baby boy. There is always one adult and the baby indoors. To cap all this, the adjoining garage now has a conservatory on the rear, so even the office in the rear of the garage is not vented to outside air. There is mould in cupboards and on walls – the windows are streaming…it’s very stuffy too.
Here’s a plan of it:
I surveyed the property, noted these things and gave some advice. However, the landlord is at the end of his tether with the mould and such, so a PIV was recommended. It is installed in the roof void, with the vent in the rear of the central hallway.
Anyway, back to the data.
Monitoring conditions here was an afterthought (sorry), so I installed the data loggers on the 4th November, the PIV was installed and turned on on the afternoon of the 9th. I have divided the data into three sections:
- The environment prior to PIV switch on
- The environment after switch on (the tenant not assisting with any ‘good practise’) After 14:20 9/11/10.
- The environment with the tenant starting to be diligent about using the bathroom and kitchen extractor fans (from 16:21 19/11/10).
| External data | Internal data | ||||
| Section 1 | 122 readings | Section 1 | 122 readings | ||
| Air temp | 80C | Air temp | 16.80C | ||
| Humidity (RH%) | 83 | VP = 0.9kPc | Humidity (RH%) | 80 | VP = 1.6kPc |
| Section 2 | 242 readings | Section 2 | 242 readings | ||
| Air temp | 5.40C | Air temp | 15.70C | ||
| Humidity (RH%) |
87 | VP = 0.8kPc | Humidity (RH%) | 67 | VP = 1.2kPc |
| Section 3 | 67 readings | Section 3 | 68 readings | ||
| Air temp | 60C | Air temp | 160C | ||
| Humidity (RH%) |
92.0C | VP = 0.8kPc | Humidity (RH%) | 67.3 | VP = 1.2kPc |
Over the period there was not much change in the overall PV of the external environment; it remained at about the 0.9 to 0.8 mark. The internal environment fluctuated, but shows a clear and consistent change, after installation of the PIV, with RH and PV falling significantly.
There wasn’t much difference after the 19th, which may be due to the short sample period, the tenants admittance that he did use the fan a bit before then, or the fact that the PIV was by far the main influencing factor, with the crap extraction being insignificant….who knows?
Looking at the apparently arbitery ‘occupancy’ levels in BS5250, this ‘wet occupancy’ now falls to a ‘moist occupancy’. Whilst this is not earth shattering, it is impressive; remember, this is a ‘problem house’ with design issues that predispose it to condensation problems.
Look also at the dew point plot on the internal data. Notice that the gap between the air temperature and the dew point has widened since the PIV was activated? This means that the walls and other cold surfaces have to be several degrees centigrade cooler than before; to attract condensation. Maybe the mould colonies I looked at last time I visited won’t find conditions so appealing now?
The tenant has agreed to allow me to return to follow up their fortunes over the winter. We’ll see how this develops and I’ll blog any significant developments. I have also shecduled installation in Leeds, Harrogate and Ilkley; I’ll ask the tenants for permission to log these too.
Dry Rot.
PS – please bear in mind that a Psychrometric chart is not designed to give readings to more than a point – the lines on the graph are too thick to start quoting two or three places and as such my figures may be a tad out; if you check them against the data.


Thanks for this data – it is helping me to decide whether to fit one or not. Keep up the great work.
Hi Jonathan,
Thank you for getting in touch. You do not say how well ventilated the house is at the moment or what sort of heating regime you have. PIV will only help if the high humidity is due to either poor ventilation or excessive water vapour production.
If the house is poorly ventilated (lack of extraction in the kitchen and bathroom), this will drive up humidity. If you have lots of dogs, cats and children, with lots of drying wet clothes then even if ventilation is quite good – it will still be humid. A PIV will help in this case merely by increasing the air changes.
There is very rarely more humidity outside than inside a house. Remember that the house is a tiny space occupied by you – you’re a bag of warm water really lol. The external environment is actually quite well ventilated….
If on the other hand you have good ventilation and quite low water vapour production then the problem could be that the house is just a little too cold.
Bryan